Real-Time Asset Visualization Tool for Rail and Road Vehicles
Our client is a market leader in the realm of internet access
solutions, specifically tailored for rail and road transport
vehicles. This front-runner in the industry amasses an array of
traffic information and data that is pivotal in making key decisions
within the transport sector.
The client entrusted us with a pivotal task – to develop a real-time
asset-tracking platform. This tool was supposed to aim at
visualizing intricate traffic data and transforming it into
valuable, comprehensible insights for their clientele. Furthermore,
this system was envisioned with an additional goal in mind - to
drive customer engagement.
Challenges
At the beginning of our collaboration, we identified several key challenges that are aimed to address. By acknowledging and prioritizing these challenges, we were able to lay a strong foundation for our work.
Custom map view
Developing a custom map view that effectively showcases the client's brand and highlights the unique aspects of their product
High performance
Ensuring high performance for the complex animations integrated into the web platform, while minimizing the impact on hardware load
Sophisticated feature
Finding an innovative approach to implement a sophisticated feature known as "connected hovering"
Solution

Seamless integration of various elements
We began our journey by prioritizing the user experience (UX) aspect. Given that the platform's main focus is on maps, it was crucial to ensure seamless integration of various elements such as graphs, train schedules, hardware performance, and other relevant information. Our aim was to create a cohesive and intuitive interface.

Map experience to the specific requirements
For the map component, we opted for Mapbox due to its versatility in terms of both user interface (UI) customization and viewing settings. This allowed us to tailor the map experience to meet the specific requirements of the project.

The iterative approach for all the desired features
In terms of performance optimization, we took an iterative approach. Once the core functionality was developed, we collaborated closely with the client to conduct comprehensive tests and identify areas for improvement. Subsequently, as we delivered all the desired features and the client had no further plans for expansion, we embarked on a focused refactoring phase. This meticulous process resulted in a remarkable 30% enhancement in performance.

Connected hovering – gathering data and linking specific data points
Lastly, let's delve into the most intricate feature: connected hovering. This feature involved gathering data from various API requests and linking specific data points based on time and location. Since the data points naturally had different coordinates and timestamps, we engaged in several brainstorming sessions with the client to devise an effective algorithm. Through our collective efforts, we successfully achieved seamless data integration and visually presented it on the dashboard.
Features
Features
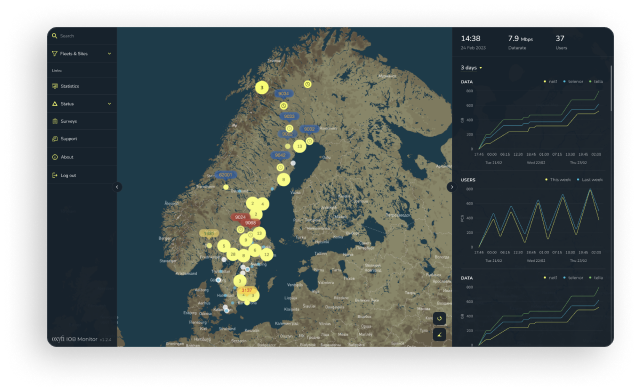
Transport facility tracking on the map
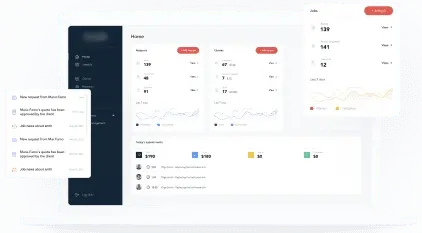
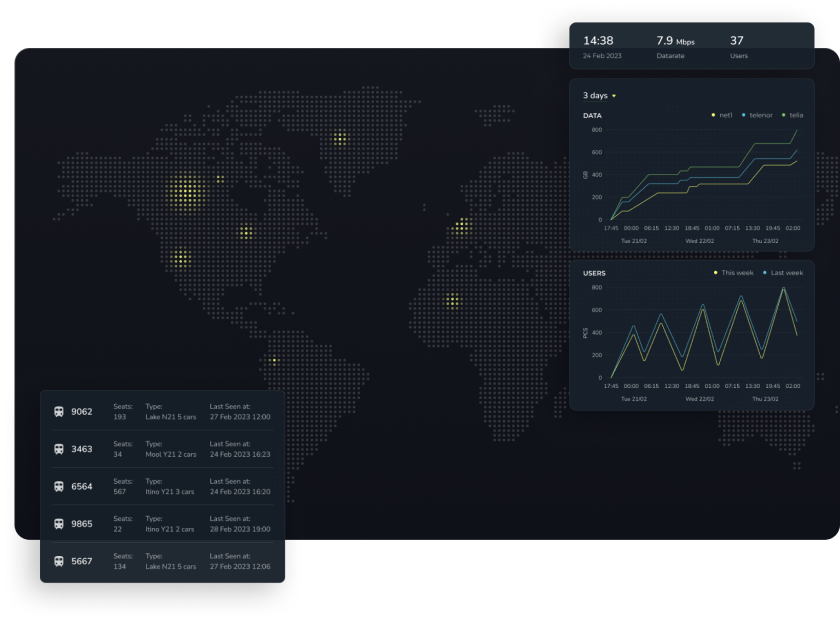
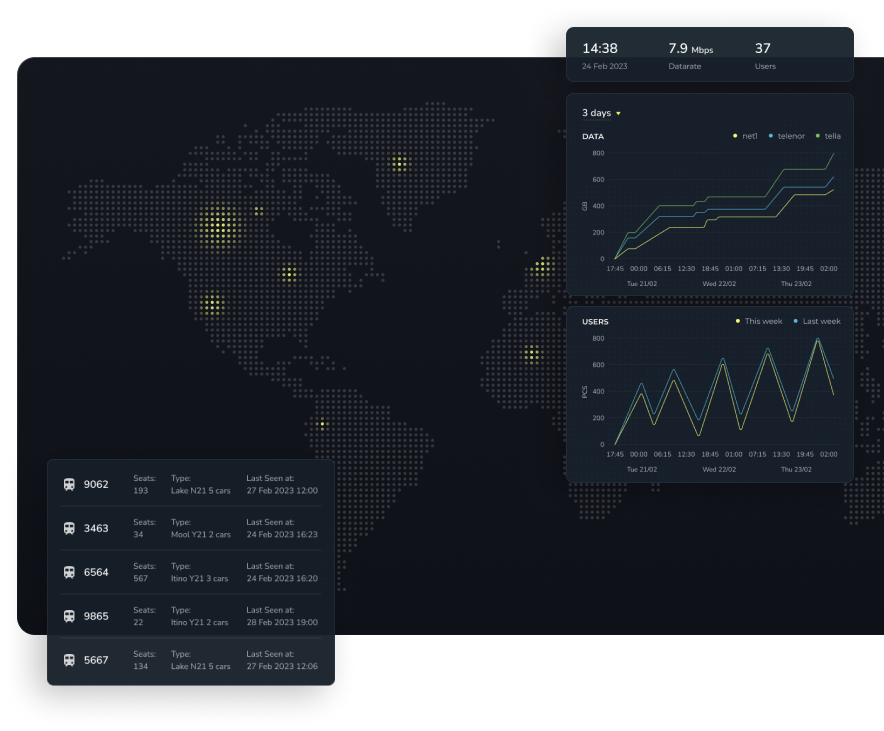
This feature enables users to see the locations of all transport facilities on an interactive map. It goes beyond mere display by providing comprehensive information and statistics through convenient and interactive graphs and charts.
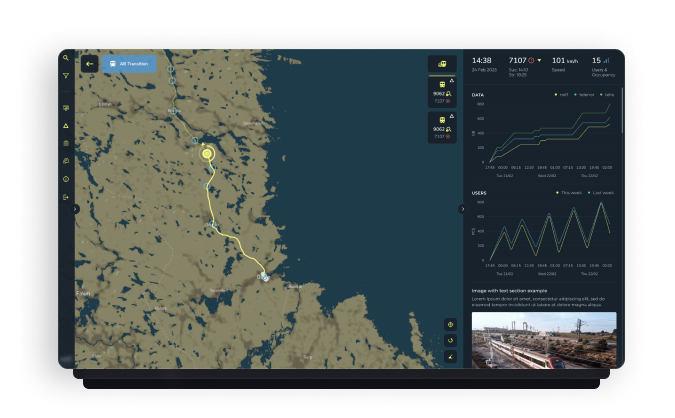
Individual transport facility view
Users have the ability to track individual transport facilities in real time as well as explore their historical data. This feature allows for a detailed examination of specific transport units at any desired point in time.
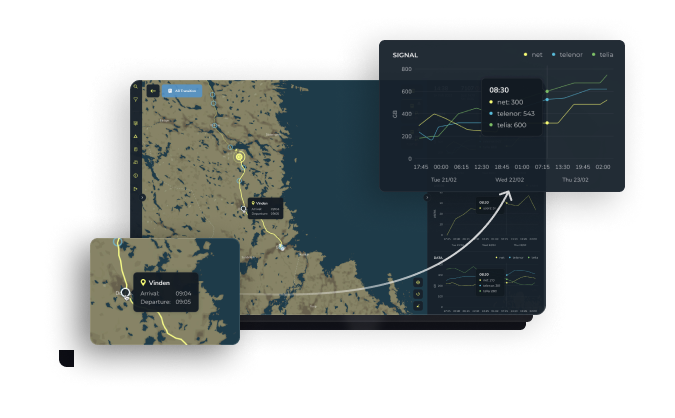
Connected hovering
To gain deeper insights into hardware performance, users can utilize the connected hovering feature. By simply hovering over a specific point on a path, all relevant data points are highlighted on the graph, offering users a clear understanding of how the hardware performed at that particular location and time.
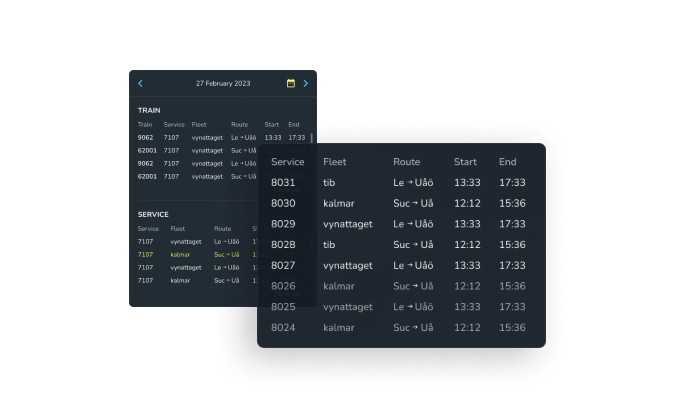
Search functionality
The platform incorporates a powerful search functionality that empowers users to find specific assets swiftly. Additionally, users can access schedules and delve into historical data, providing them with a comprehensive view of relevant information.
Tech Stack
Vue.js V3
RxJS
WebSockets
Mapbox-gl
Turf.js
Client’s feedback
Despite the absence of formal metrics, the product has consistently surpassed expectations, leaving clients thoroughly impressed. The Requestum team has proven its remarkable adaptability by readily embracing suggestions and swiftly implementing changes. Their commitment to open and transparent communication has effectively fostered a shared understanding among all team members.
Company Founder

Results
We have successfully developed an advanced platform that not only empowers our client to gain invaluable insights into hardware performance but also enables enhancing services. In addition, this platform serves as a unique selling proposition, offering exceptional user engagement. The client has effectively utilized this tool to drive product sales to their customers.
Furthermore, our team's recent refactoring update has yielded remarkable results, boosting the platform's performance by an impressive 30%.
